In my previous GDB post, I went over many common debugger commands while exploring the stack build up and initialization of stack variables for the main function in a simple C program. In this post I’ll use more GDB commands to further inspect the body of this small program.
Quick references:
- GDB Cheat Sheet
- Example program source at: Debugging C Programs with GDB – Part 1
For Loop Assembly
To dig deeper into the exact operation of my main function, I’ll first look at the block of instructions the compiler built when interpreting and optimizing my C code.
0x0000000000400575 <+15>:	mov    DWORD PTR [rbp-0x4],0x0
0x000000000040057c <+22>:	jmp    0x400596 <main+48>
0x000000000040057e <+24>:	mov    eax,DWORD PTR [rbp-0x4]
0x0000000000400581 <+27>:	mov    esi,eax
0x0000000000400583 <+29>:	mov    edi,0x40064a
0x0000000000400588 <+34>:	mov    eax,0x0
0x000000000040058d <+39>:	call   0x400440 <printf@plt>
0x0000000000400592 <+44>:	add    DWORD PTR [rbp-0x4],0x1
0x0000000000400596 <+48>:	cmp    DWORD PTR [rbp-0x4],0x9
0x000000000040059a <+52>:	jle    0x40057e <main+24>
0x000000000040059c <+54>:	mov    rax,QWORD PTR [rip+0x200a9d]
0x00000000004005a3 <+61>:	mov    rdi,rax
0x00000000004005a6 <+64>:	call   0x400430 <puts@plt>
As seen at the end of the previous post, the instruction at <+15> (15 bytes into main) is setting PTR [rbp-4] to 0, which for this program is the i iterator variable used in the for loop of main. This is the implementation of the initializer i = 0; in my for loop.
The program then unconditionally jumps to <+48>, which compares (cmp) i to 9. This compare instruction will change some CPU flags that are use with conditional jumps such as the jle (jump if less than or equal) instruction that follows. This cmp/jle combo is the implementation of the condition of the for loop: i < 10. This shows us that the compiler decided this was better implemented as i <= 9.
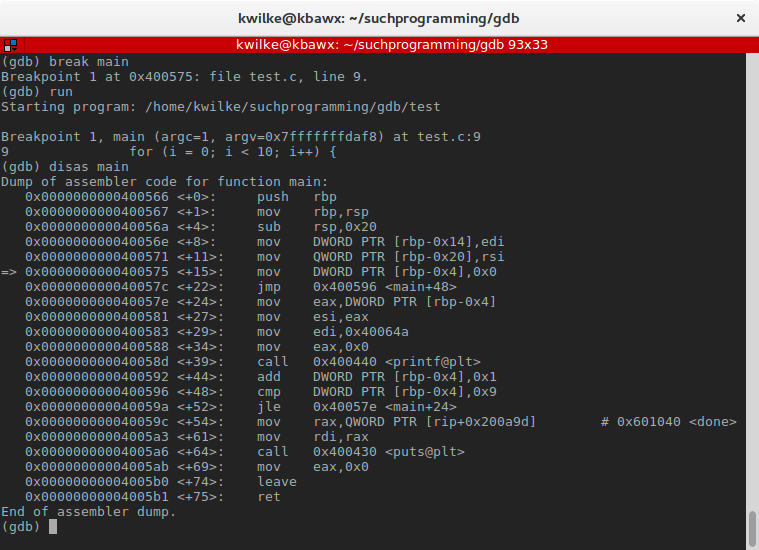
Now I’ll watch the loop a bit more closely. I’ll start off by adding the breakpoint at the start of main with break main, start the program with run, and disas main to verify where the breakpoint was set.
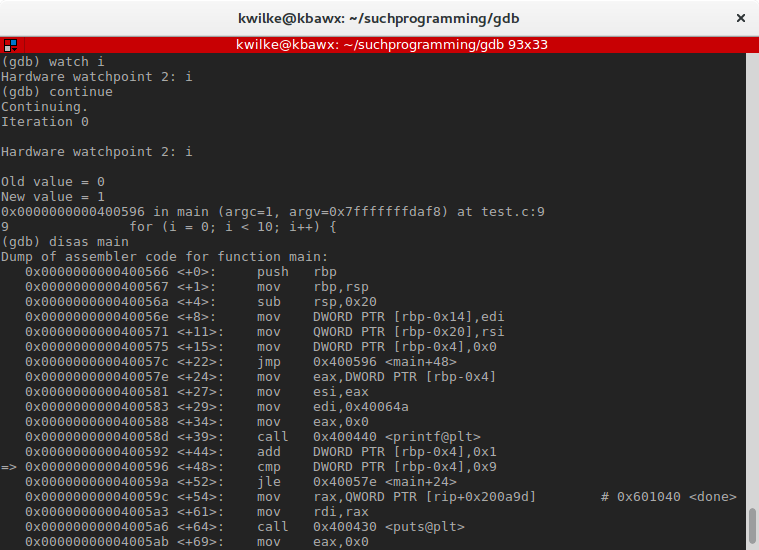
Now I’ll use watch i to ask GDB to notify me of changes to i. When I continue the program, it’ll run until the value of i is modified, which happens during the add instruction at <main+44>. This instruction, add DWORD PTR [rbp-0x4],0x1], is the i++ step of my for loop.
With i incremented, the program checks to see if another iteration of the loop should be ran by comparing i to 9. When this comparison happens various CPU flags are modified in the process. If we check the flags before and after the cmp, we can see what’s getting changed.
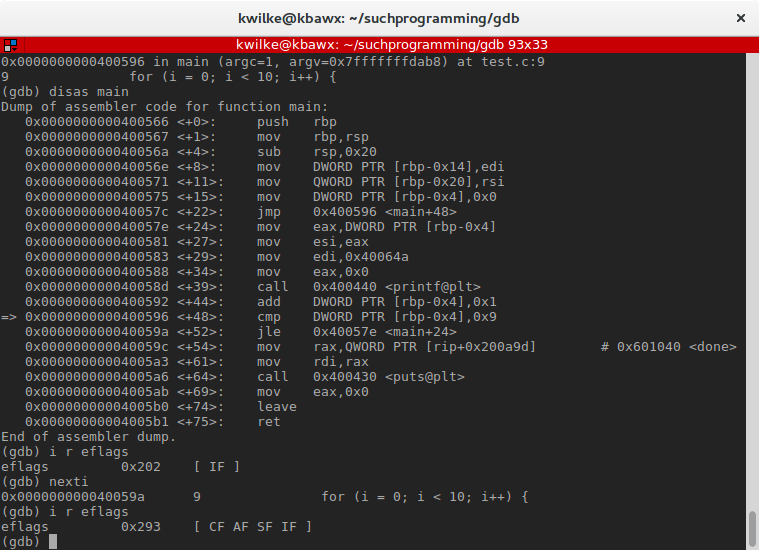
The cmp operation will substitute i by 9 to see what the difference between them is. In this case the operation was 1 - 9, so -8. The flags that jle will look for is the zero flag ZF that indicates the result is 0 (and the numbers compared are equal) or the sign flag SF that indicates the result of the operations resulted in a negative number. With how this program is written, jle will always jump the program to <main+24> until i is 10, as cmp will have cleared both the zero and sign flags at that point so no jump will be taken.
Calling Function
Inside of this loop, not too much is going on. The body of the loop is setting up some parameters to be passed to the printf() function, then calling it.
0x000000000040057e <+24>: mov eax,DWORD PTR [rbp-0x4]
0x0000000000400581 <+27>: mov esi,eax
0x0000000000400583 <+29>: mov edi,0x40064a
0x0000000000400588 <+34>: mov eax,0x0
0x000000000040058d <+39>: call 0x400440 <printf@plt>
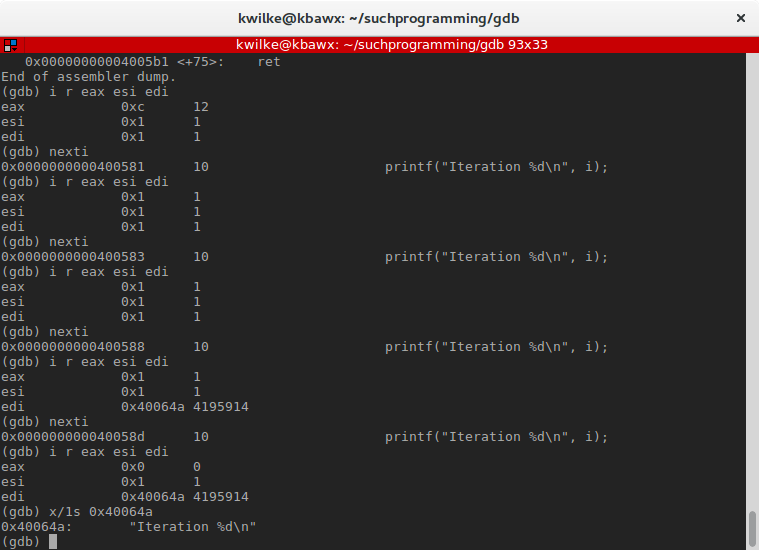
So I’ll set a new breakpoint at *0x40057e to watch more closely what’s going on at that point. I’ll use nexti and i r <registers> to monitor the register changes during these operations.
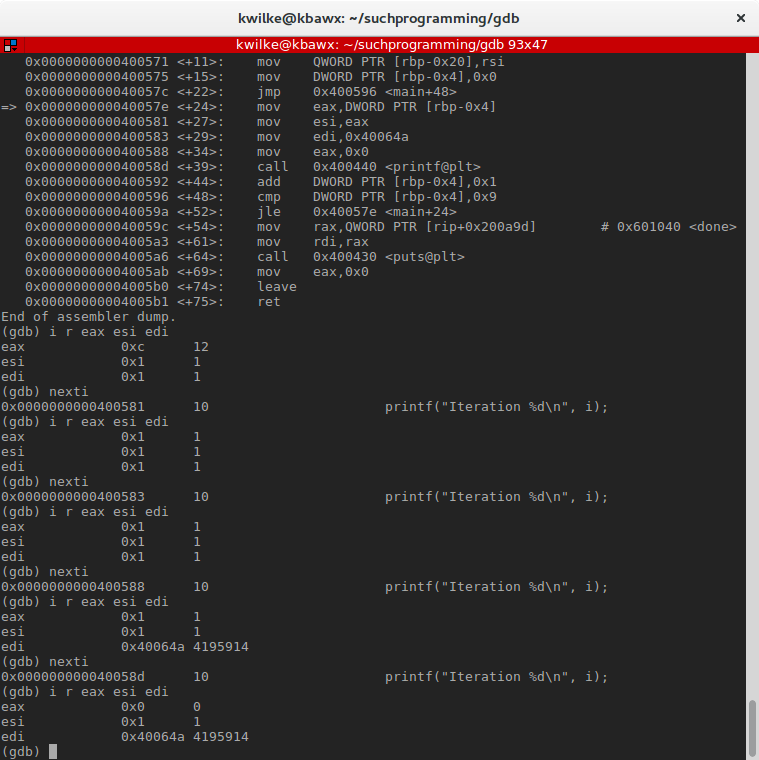
So generally it looks like eax was used to grab the value of i, then set esi to it. I’m not sure why this was done, but the compiler usually knows what it’s doing so I trust it’s for a good reason. The last mov sets eax to 0 so the value of i is only set in eax for usage in the next instruction. There’s also a mov here to set edi to 0x400440.
I referenced the calling convention for System V x86_64 and see that rdi and rsi are the first and second registers used as parameters in a function call. Matching my C call to printf, edi is my string and esi is the i variables value. I can take a look at this string with x similar to how I inspected numbers before, but I’ll use s as the display type indicator.
The last instruction of the loop body is simply the call to the address of the printf function.
After the Loop
After our for loop finally completes, there are just 6 more instructions to run before main is complete.
0x000000000040059c <+54>:	mov    rax,QWORD PTR [rip+0x200a9d] # 0x601040
0x00000000004005a3 <+61>:	mov    rdi,rax
0x00000000004005a6 <+64>:	call   0x400430 <puts@plt>
0x00000000004005ab <+69>:	mov    eax,0x0
0x00000000004005b0 <+74>:	leave
0x00000000004005b1 <+75>:	ret
I hope you’re used to what mov does by now, though in this case it’s doing another offset with an important register I haven’t yet touched on, rip. This is the Instruction Pointer, this register keeps holds the value of the next instruction the CPU should execute.
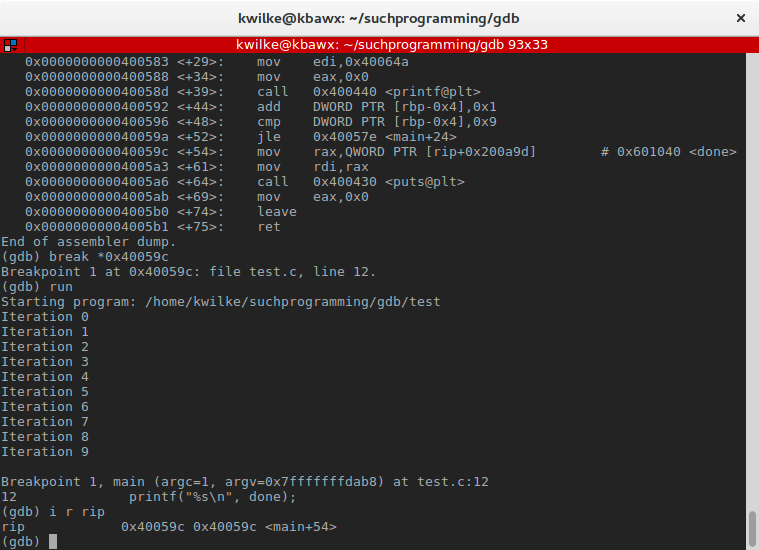
Here I restarted my debugger and set a breakpoint at the <main+54> instruction. I can confirm that’s the next instruction to run because rip is set to that same address. It’s interesting that the compiler decided to use an offset from a register that’s always going to be the same value, GDB even noticed this and tells me the final address will be 0x602040.
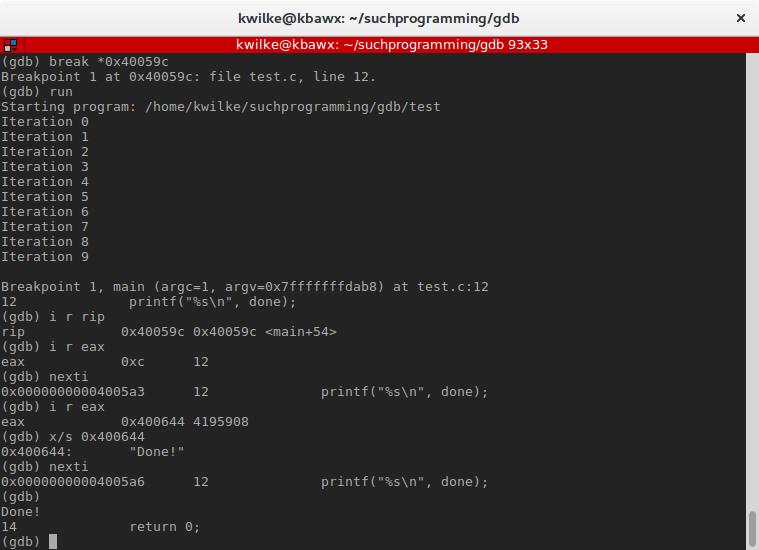
Just as before, this is pulling up a string (character pointer) that’ll be used in the puts function call. This pointer has a much different address because of how I defined it in my program. This one was the global variable done, as opposed to my Iteration %s\n string which was a variable in the function scope of main.
The last mov of the program is setting eax to 0, this register is used as the return value of a function call and I wrote main to return 0. The leave begins restoring the stack to as it was before main was called and ret completes the exit of my main function. Internally libc will hold onto the value main returned, do some cleanup then make a system call to exit() with that return value to notify the OS that the program has completed.
With all that I hope this provides a helpful introduction to GDB and some x86 assembly. GDB has a ton of features and this only scratches the surface but I wanted to share these basics as I’ll be using them in future posts when I dive more into advanced C topics.