In my previous post I covered a few basics around building a C program for debugging, looking at the code listing and assembly of the program, setting breakpoints and peeking into the registers.
For Part 2, I’ll be using more gdb commands to explore the assembly code that’s involved in building up and initializing the stack frame at the start of a function.
Stacking Up
I want to dig down into every bit of what this program is doing, I’ll begin by pulling up the disassembly version of the program once more.
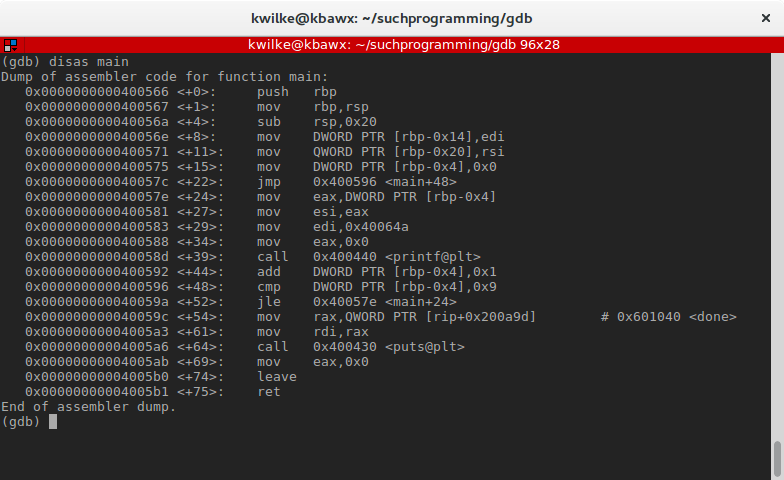
If I use break main to set a breakpoint at the start of my main function, GDB will be practical and set this breakpoint at the address 0x400575, 15 bytes into the assembled version of main. It’ll do this because the first 6 instructions of the function are setting up the stack for the function and normally you can trust that the compiler has done a good job handling that for you.
I want to really start at the beginning, so I’m going to instead set my breakpoint with a pointer to the first byte of the function with the command break
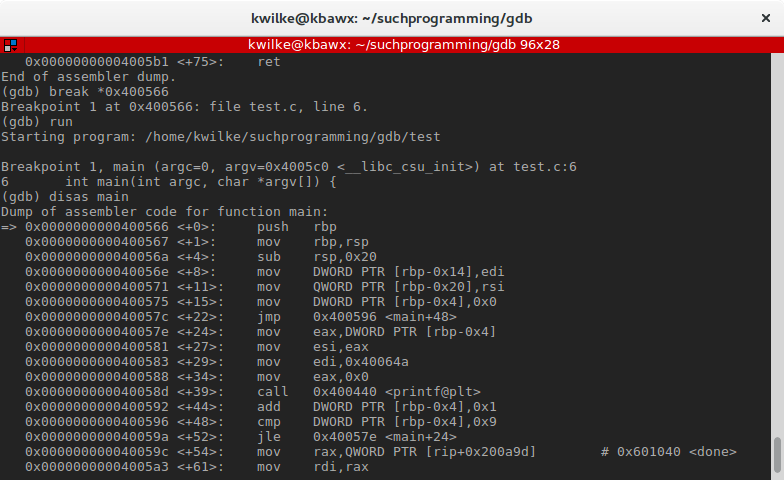
The first assembly instruction seen here is push rbp. This is pushing the value stored in the rbp (base pointer) register onto the stack, but where is the stack? The rsp (stack pointer) register tell us where the top of the stack currently is.
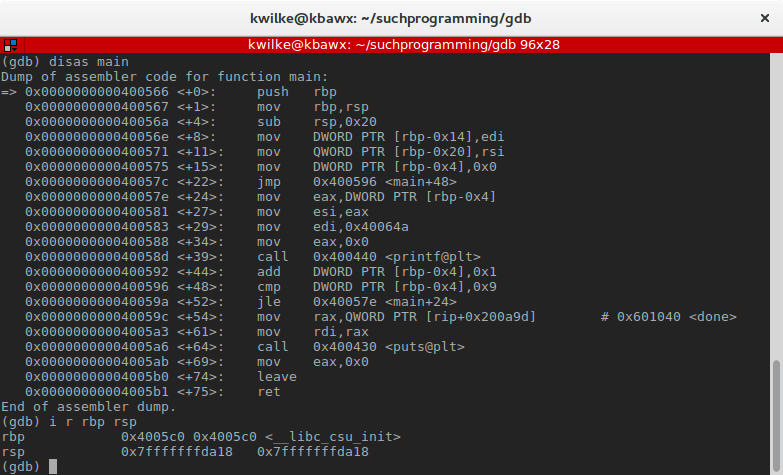
These first 3 instructions are building a new call stack frame. Since this program uses libc the program starts by running code to initialize a few things then calls the main function that was created in the source code. The compiler adds these instructions to build out the stack frame for the given function.
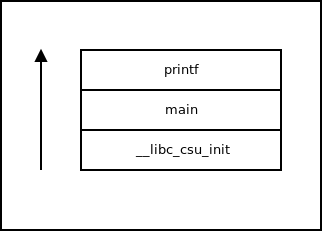
As mentioned before, the rsp register points to the points to the top of the stack. By running nexti (next instruction), I can execute one machine operation at a time. After letting push rbp run, the current value of rbp is added to the top of the stack. While this happens, the stack grows and rsp will be updated to the new top of the stack.
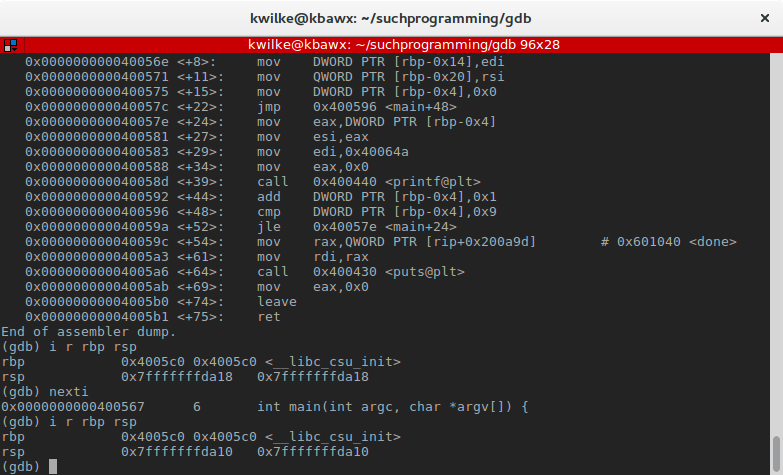
The value of rbp hasn’t changed, but the value of rsp is 8 bytes smaller. In most CPU architectures the stack grows “down” like this, where the lowest call frame represents the current frame.
Peeking Into Memory
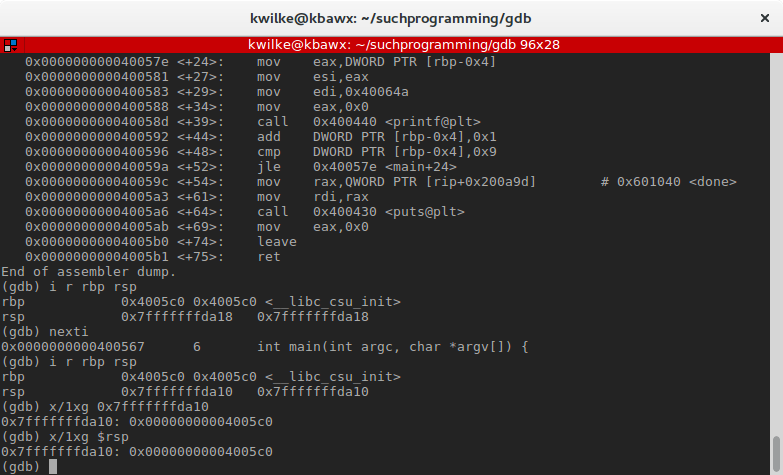
We should now be able to see the rbp value at the top of the frame. By using the x command to print data in memory, we can take a look at the frame. x has a few useful options, while you’re learning GDB they can be tricky to remember so I recommend keeping a cheat sheet handy until you’ve got it down.
To look at the value at the top of the stack, I’ll use x/1xg 0x7fffffffda10. This is asking to see 1 unit of data, in hexadecimal format, considering 64-bit “giant” words. You can choose instead to dereference the rsp register directly in the command by using $rsp for the address.
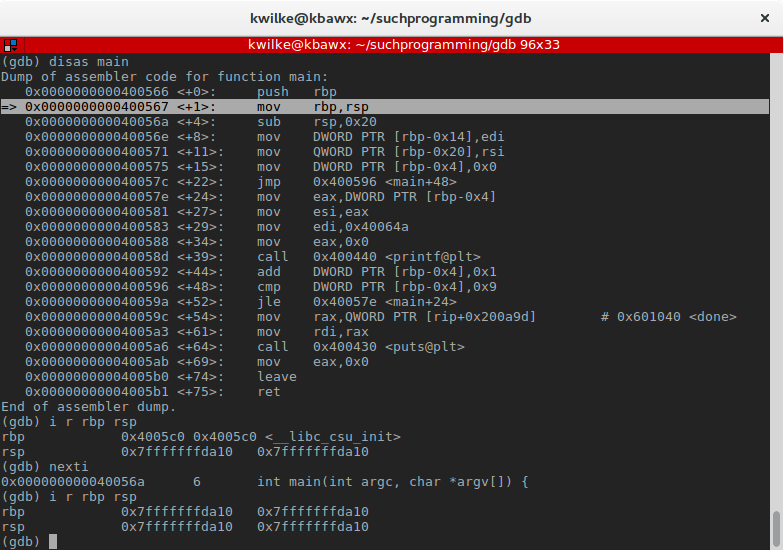
With the commands covered so far we can more easily inspect what each instruction is doing. The next instruction is mov rbp, rsp, this moves the value of rsp into rbp. This is to set the base pointer to the top of the previous stack frame which is used at the end of a function to restore the previous stack state.
The next instruction, sub rsp,0x20, lowers the value of rsp by 32 (4 64-bit words). This is the size of the frame being built for main. Using x again, I’ll look at the 4 words in the stack, plus the next word after (the rbp value that was pushed to the stack).
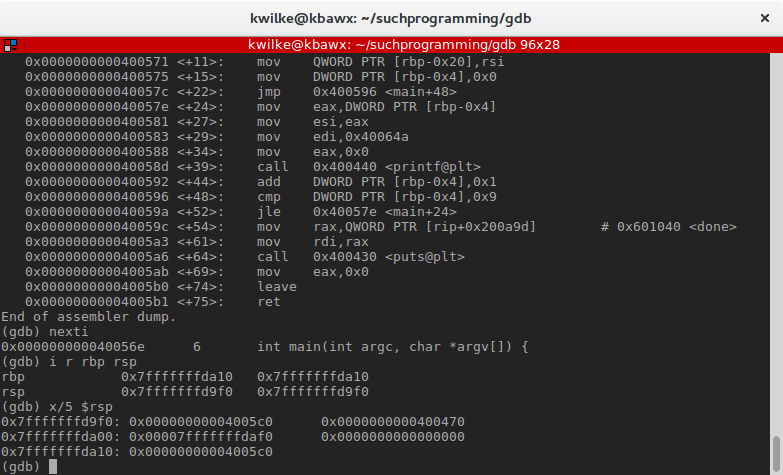
There’s already data in this stack! This is data left over from previous execution and is considered uninitialized, as this function doesn’t know what data was been left behind here. When gcc warns that 'i' is used uninitialized in this function [-Wuninitialized], it is because the program is using a variable that’s not in a known state.
Pointers IRL
The next 3 instructions are going to be initializing the new stack frame region using pointers. If you’ve been confused about pointers in C, pointers in assembly might help demystify that concept for you. Let’s consider the next 3 instructions:
=> 0x000000000040056e <+8>:     mov    DWORD PTR [rbp-0x14],edi
   0x0000000000400571 <+11>:    mov    QWORD PTR [rbp-0x20],rsi
   0x0000000000400575 <+15>:    mov    DWORD PTR [rbp-0x4],0x0
These are assignment operators that refer to addresses relative to a memory address that is stored in a register. In this case they are modifying the data in the new stack frame (addresses below rbp). Sometime before main was called, the edi and rsi registers were set to some values that the compiler wants kept around.
The first instruction here is setting a 32-bit (Double Word) at the memory address 20 bytes below rbp. I’ll need to give x a w parameter so that it’ll know I’m now looking for a 32-bit word.
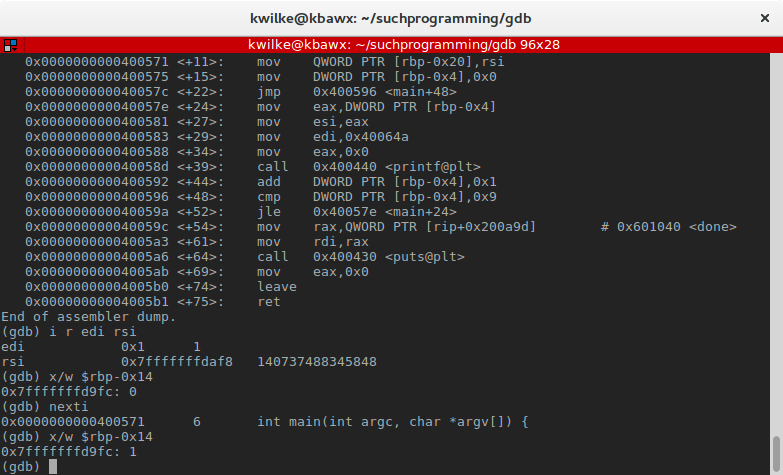
Basically the same thing going on for the next instruction, but setting the memory address 32 bytes below the base pointer to the 64-bit value currently in rsi.
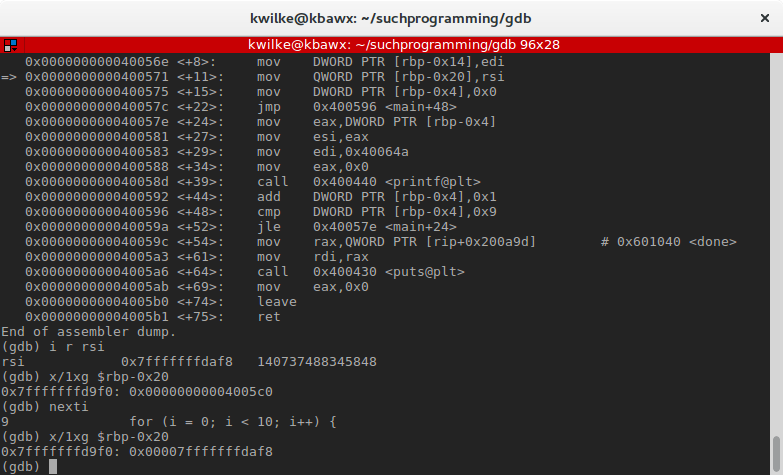
These registers (*di, *si) are index registers that can be used for various string operations. They are also part of the x86_64 calling convention to be used when calling functions. In this case, these registers contain the parameters for main, my argc and argv variables.
We can use the print command to look at the variables as they were named in the source code. The & operator can be used similar to how it used in C to verify that these variables are stored at those locations in the stack.
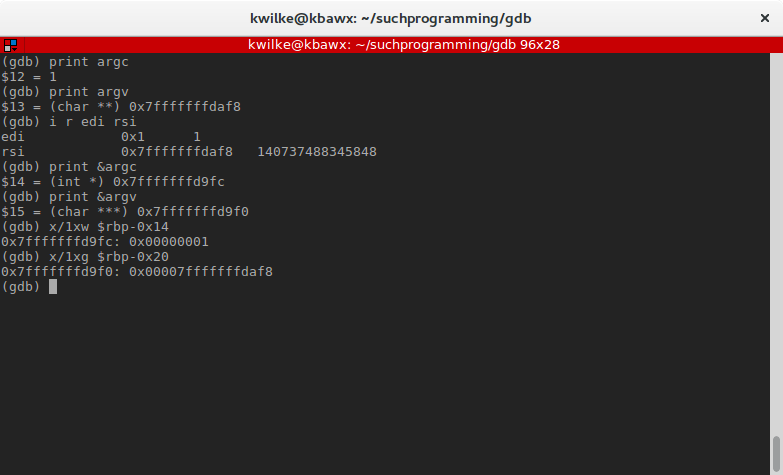
The next instruction, mov DWORD PTR [rbp-0x4],0x0, is the i variable used within the for loop inside of main, here being initialized to the value we specified, 0.
At this point the stack for main is initialized and main is ready to do its thing. In the next post I’ll continue the GDB exploration to investigate the rest of what this function is up to!