When you write C code, you’re playing with power! You’re bound to let this power go to your head and shoot yourself in the foot here and there. At some point(s) your program is going to do something that just doesn’t quite make sense.
The bad news is that your program doesn’t make any sense because you’ve written flaws into it. That’s fine, you’ve either written janky C programs, or not written any C. The good news is that GDB is here to help us learn from our mistakes!
Through the next few posts I’ll share some tips on basic GDB usage, explore a bit of history and dig more into how the C programs on my machine are actually working.
Building for Debugging
To kick things off, I’m going to just slap together a quick C program and a Makefile to assist in building it and running my debugger.
// test.c
#include <stdio.h>

char *done = "Done!";

int main(int argc, char *argv[]) {
  int i;

  for (i = 0; i < 10; i++) {
    printf("Iteration %d\n", i);
  }
  printf("%s\n", done);

  return 0;
}
This program has a simple for loop and a few print statements and I’ll use GDB to inspect what it’s doing a bit more. To provide more information to the debugger about this program I’ll use the -g flag when building it.
# Makefile
CC=gcc -g -o $@ -Wall $<

all: test

test: test.c
	$(CC)

debug: test
	gdb -q ./test
For maximum laziness, I added a debug target to my Makefile here so that I can use make debug to jump right it. I gave gdb the -q option to quiet down since it normally has a lot to say on startup.
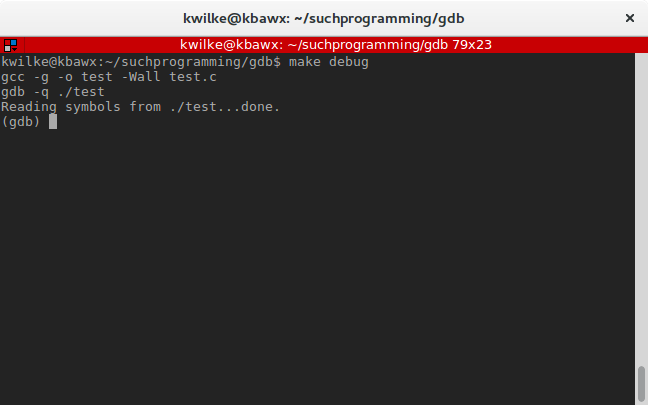
That’s about all I need to get my program ready for debugging!
Basic Commands
Now we get to the hard part. GDB has a bajillion features so getting started can be daunting. Probably one of the best commands to learn first is the run command, as so far the program has been looked at a little bit, but isn’t actually running at the moment.
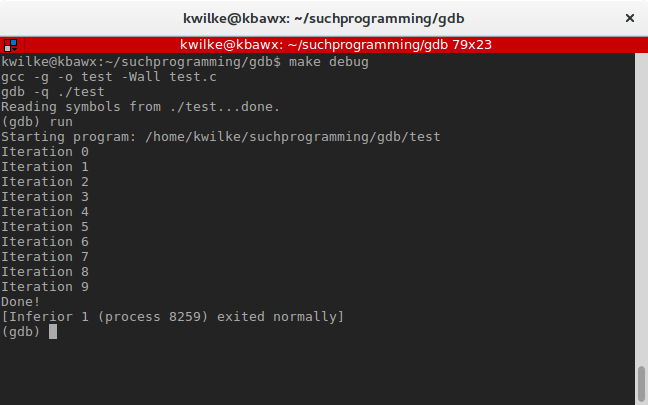
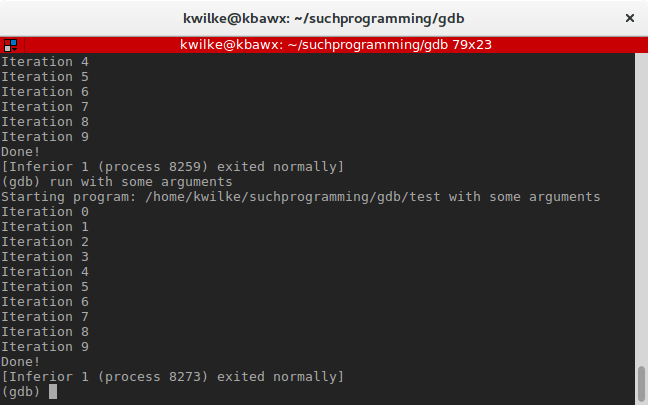
You can also provide arguments to the program by providing arguments to run. This program doesn’t care about arguments, but don’t let that stop you from giving it some anyway!
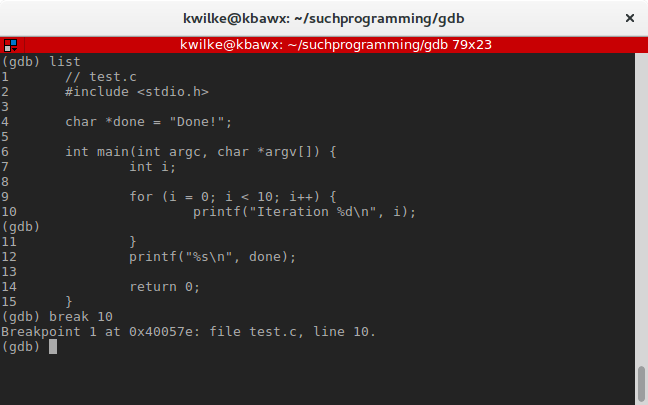
The excitement of just running a program in GDB is very short lived, I want to be able to stop the program somewhere and poke around a bit. The list command can spit out a listing of the program.
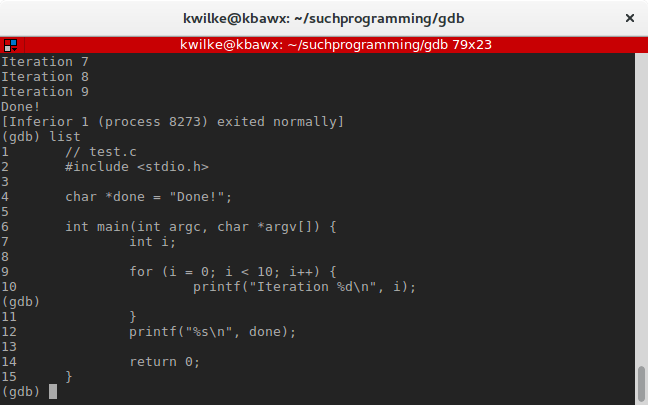
Initially gdb will show the first 10 lines of the source. You could run list again to see the next 10 lines but GDB has a friendly feature where hitting enter will automatically rerun your last command, so I used that to continue reading the full source.
Looking at this listing, I think a good place to pause and look around would be at the printf() call within my for loop. To have GDB stop here I’ll use the break command and I’ll give it the argument 10 to indicate I’d like to set a breakpoint at line 10.
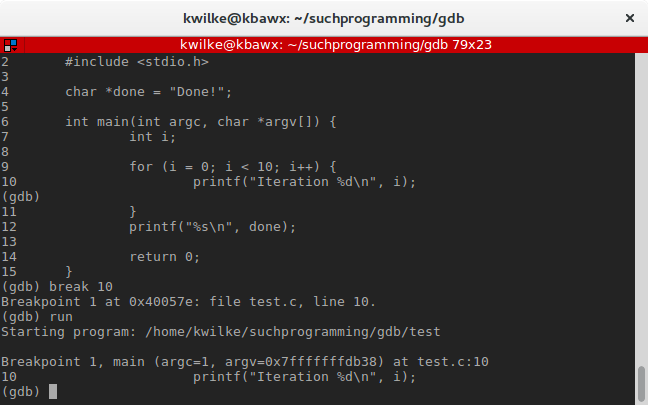
Now when I give it a run, it’ll stop the program when it hits that line.
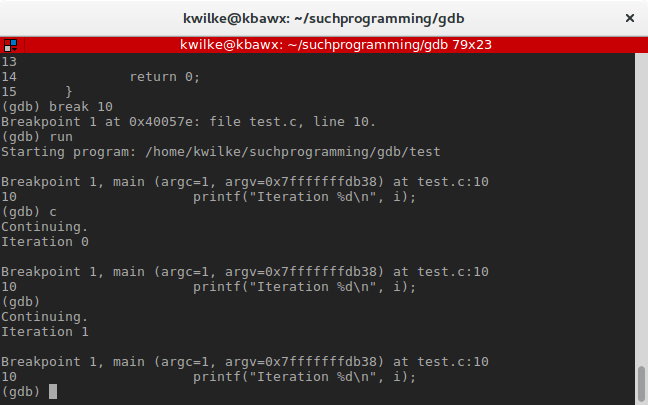
To resume the program, until the next breakpoint is hit, you can use the continue command. Another little time-saver trick with gdb is that many commands have shortcuts, such as c for continue.
Peeking Into The Code
The ability to set breakpoints and resume execution is a good start, but even better is getting a look around at this point in time to glean more about what the program is doing. It’s time to start looking beyond the C code and see what the program is actually doing in assembly, the state of the CPU in the context of our program and what’s going on in memory.
First let’s look at the assembly version of the main function. I’ll use the disassemble command for that, and I’ll tell it that main is what I’m interested in disassembling.
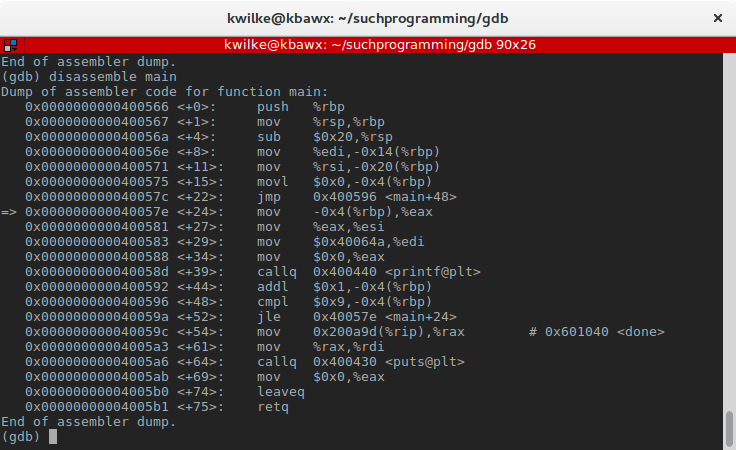
Assembly code get’s a bad rep, but it’s not as bad as people think it is. You might not want to write a large application in assembly, and that’s reasonable, but if you want to be a strong C programmer you need to know enough assembly to figure out what your program is up to.
x86_64 assembly has two different syntaxes to choose from, AT&T syntax and Intel syntax. They both work just fine but GDB defaults to AT&T syntax and I prefer the Intel syntax so I’ll use the command set disassembly-flavor intel to get it to my liking.
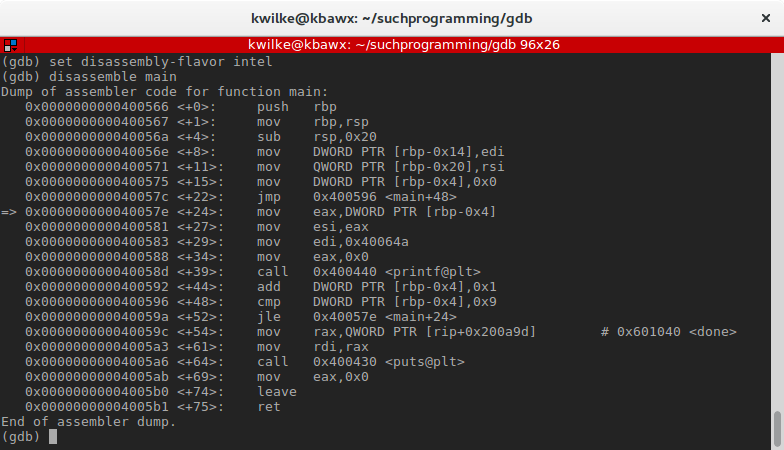
That looks better! Now let’s briefly look at a few things. Looks like my main function is 21 instructions long, alright… a smidge more than half of the operations are mov (move) instructions and I see a few branching operations, jmp (jump), call (call a subroutine), jle (jump if less than or equal to) and ret (return from subroutine).
One thing I find interesting is the instruction at offset <+64>, call 0x400430 <puts@plt>. I did not use the puts() function in my code! The compiler caught on that my last printf() statement doesn’t need to be a format string and optimized the result a little bit.
Let’s get back to inspecting what this program is up to, I’m currently still in the middle of my paused program, and I’m at the very start of one of my loop iterations. In this disassembly output I can see I’m at offset <+24>, as indicated by the little => arrow, this is the next instruction the program will run.
The mov instruction moves a value from one place to another, similar to the assignment operator = in most programming languages. In this case the full instruction is mov eax,DWORD PTR [rbp-0x4] which is basically eax = DWORD PTR [rbp - 0x4]. Ignoring the right side of that for now, we’re assigning a value to something called eax. This eax thing is a CPU register, which is basically a variable in the hardware of the CPU. We can look at all the registers with the info command by saying info registers.
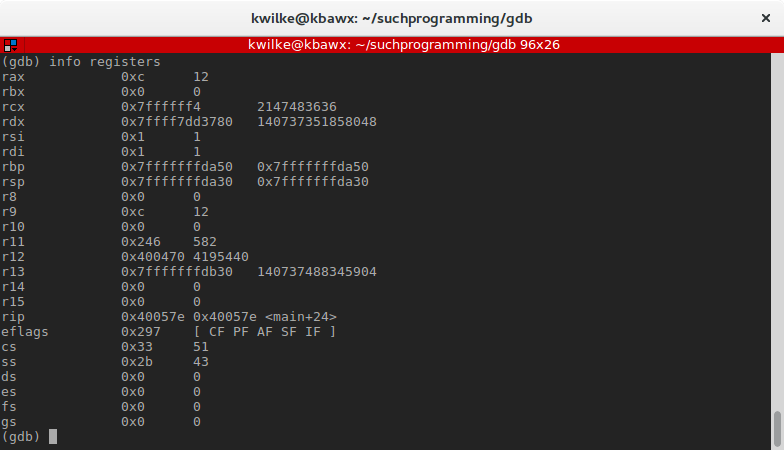
Okay so there are a bunch of registers, and eax is not one of them… GREAT! This is because the x86 architecture has been through a lot, way back in the day (early 70s) Intel released their 8008 CPU that had some 8-bit registers with names like A (for Accumulator).
When Intel got to the 8086 in the late 70s they made the A register twice the size (16-bits) and started calling it the AX register. To help with software compatibility with older system the AX register could be used as an 8-bit register with AH representing the higher 8 bits and AL the lower 8 bits.
Then the mid-80s showed up and Intel was like MOAR BITS and released their 80386 that had 32-bit registers, now they refer to the A register as EAX (there’s our guy!), again preserving backward compatibility by allowing the 16 and 8 bit registers to remain the same. Now-a-days our 64-bit processors are king, so we have the 64-bit register RAX, but can still use EAX, AX, AH, and AL.
All that history lesson to give full context on why mov eax, <stuff> is going to modify our rax register!
Now, to run just that one instruction, I’ll use the nexti command. I’ll then check the registers again with the shorthand version of info registers and just look at the eax register: i r eax
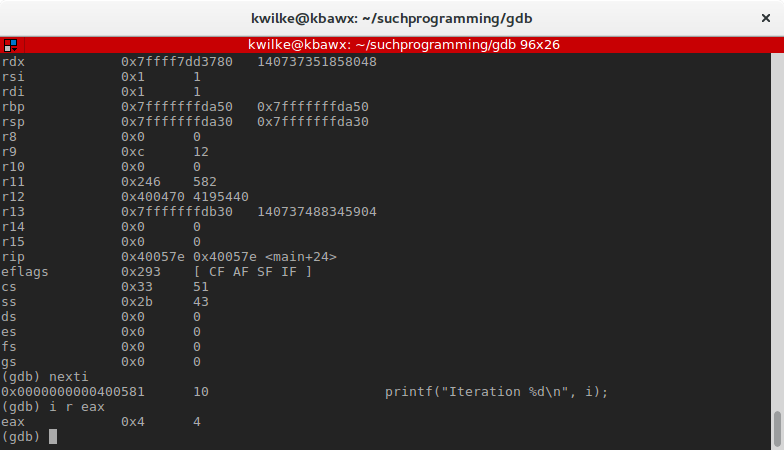
If I continue my program, I’ll notice that this number correlates with something in my program.
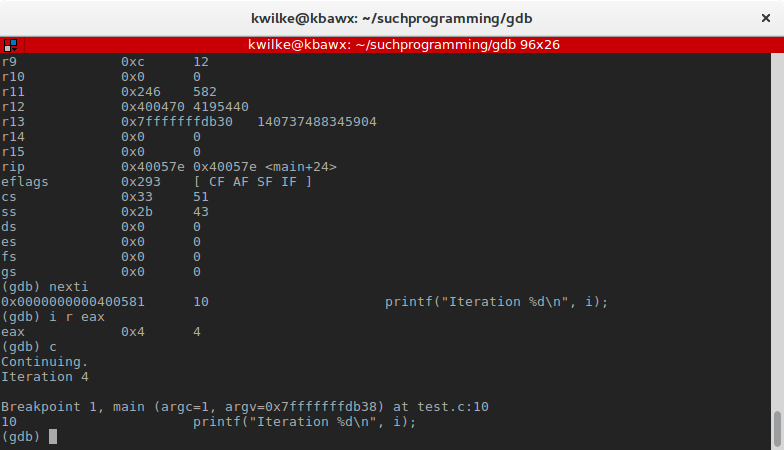
The eax register is getting set to the i value I’m setting during my for loop!
In the next post I’ll continue digging into this program and discover more about the disassembled version of my C program and show off some more GDB commands along the way!